Vlocity Facts #13 | Angular OmniScript Debugging
When creating any interface or code, debugging and testing are crucial components. We can test from Vlocity's Omniscript Designer Preview mode to analyze the execution results. But in some cases we need OmniScript must occasionally be tested under same circumstances and using the same Users and Profiles as the intended users.
Angular OmniScript Debugging
A few methods for debugging Integration Procedures and Omniscripts for Angular while they are running and how to obtain the data that is kept in OmniScript JSON storage and the data that is exchanged with Salesforce.
A few methods for debugging Integration Procedures and Omniscripts for Angular while they are running and how to obtain the data that is kept in OmniScript JSON storage and the data that is exchanged with Salesforce.
Before starting we need to know what is scope, bpTree, response and baseCrtl.
For more Details about DataRaptors and Types check this link DataRaptors For OmniScripts elements refer this link OmniScript Elements -1 How to launch Omniscript in difference ways Launch Omniscript Resources: Vlocity Resources Best Practices of OmniScript, Integration Procedure, Data Raptors How to Apply CSS Changes for Omniscript elements.
- "baseCtrl" - The "baseCrtl" angular controller defines its methods and variables.
- Scope -- definition of all available methods
Path: baseCtrl.prototype.$scope - bpTree -- the OmniScript structure definition and variables
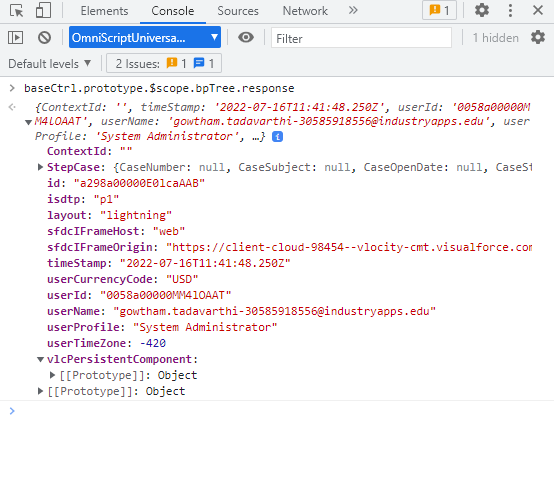
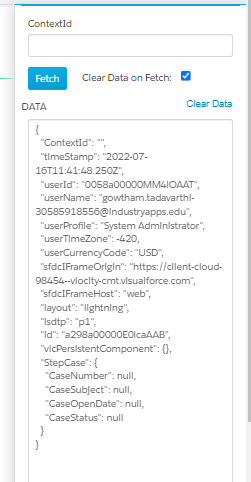
Path: baseCtrl.prototype.$scope.bpTree - response -> the OmniScript JSON Data
Path: baseCtrl.prototype.$scope.bpTree.response
We can use this example where we will get case records and update the case record in omniScript.

Debug the Omniscript JSON Data- While OmniScript is being executed right click anywhere on the OS and select “Inspect Element” to access the controller.
- The values what you are seeing in console are not refreshed automatically. To check when JSON data when ever it is updated we need to use
baseCtrl.prototype.$scope.bpTree.response - When you need to check Omniscript field values for example to check the case number in console we can use this syntax to get the field value.
baseCtrl.prototype.$scope.bpTree.response.StepCase.CaseNumber

Debug OmniScripts Actions.
All OmniScript Action components (Integration Procedure, Remote Actions, etc…) will trigger a request to the server. Server requests and responses can be monitored through the browser’s “Network” tab.
All OmniScript Action components (Integration Procedure, Remote Actions, etc…) will trigger a request to the server. Server requests and responses can be monitored through the browser’s “Network” tab.
- To check these we need to again click on Inspect element.
- Click on Network Tab and click Ctrl + R. After doing this you can check network activity on screen.
- Wait until the OmniScript action to debug is executed in the OmniScript flow.
- There should be a "apexremote" entry in the Network tab. There could be numerous "apexremote" entries depending on the OmniScript. Per OS Action, there will be one entry. Use the "Record Network" feature to set a restriction on the number of submissions.
- Select the “apexremote” entry and go to the “Headers” tab > “Request Payload” > “Data”
In the “Data” section, you’ll find the type of OmniScript action (0), the Unique name of the OmniScript: Type_Subtype (1), the payload (2) and the Action remote options (3). - Select the “apexremote” entry and go to the “Preview” tab.
The response from the server can be found under the "Preview" tab and under the "Response" tab.
===========================================================================


Comments
Post a Comment